


Mastering the Dynamics of Payer Mix and Its Impact on Healthcare Revenue
 December 24, 2025
Understanding payer mix is fundamental for healthcare providers seeking financial stability and growth. It encompasses the distribution of revenue sources, such as insurance types and patient payments, which directly influence a practice’s profitability and operational strategies. With the complex landscape of healthcare reimbursement models, grasping the nuances of payer composition enables providers to optimize their financial health while maintaining community service obligations.
Many hospitals and physicians rely on a variety of payment sources—commercial insurance, government programs like Medicare and Medicaid, and self-pay patients. The proportion of income derived from each source is known as the payer mix. This ratio can vary dramatically across different practices and institutions, acting as the primary determinant of financial sustainability. Accurately analyzing and managing this mix is crucial for strategic planning, budgeting, and negotiations with payers. In this context, the term “payer” is interchangeable with “payor,” though “payer” is more commonly used in practice.
How is payer mix defined?
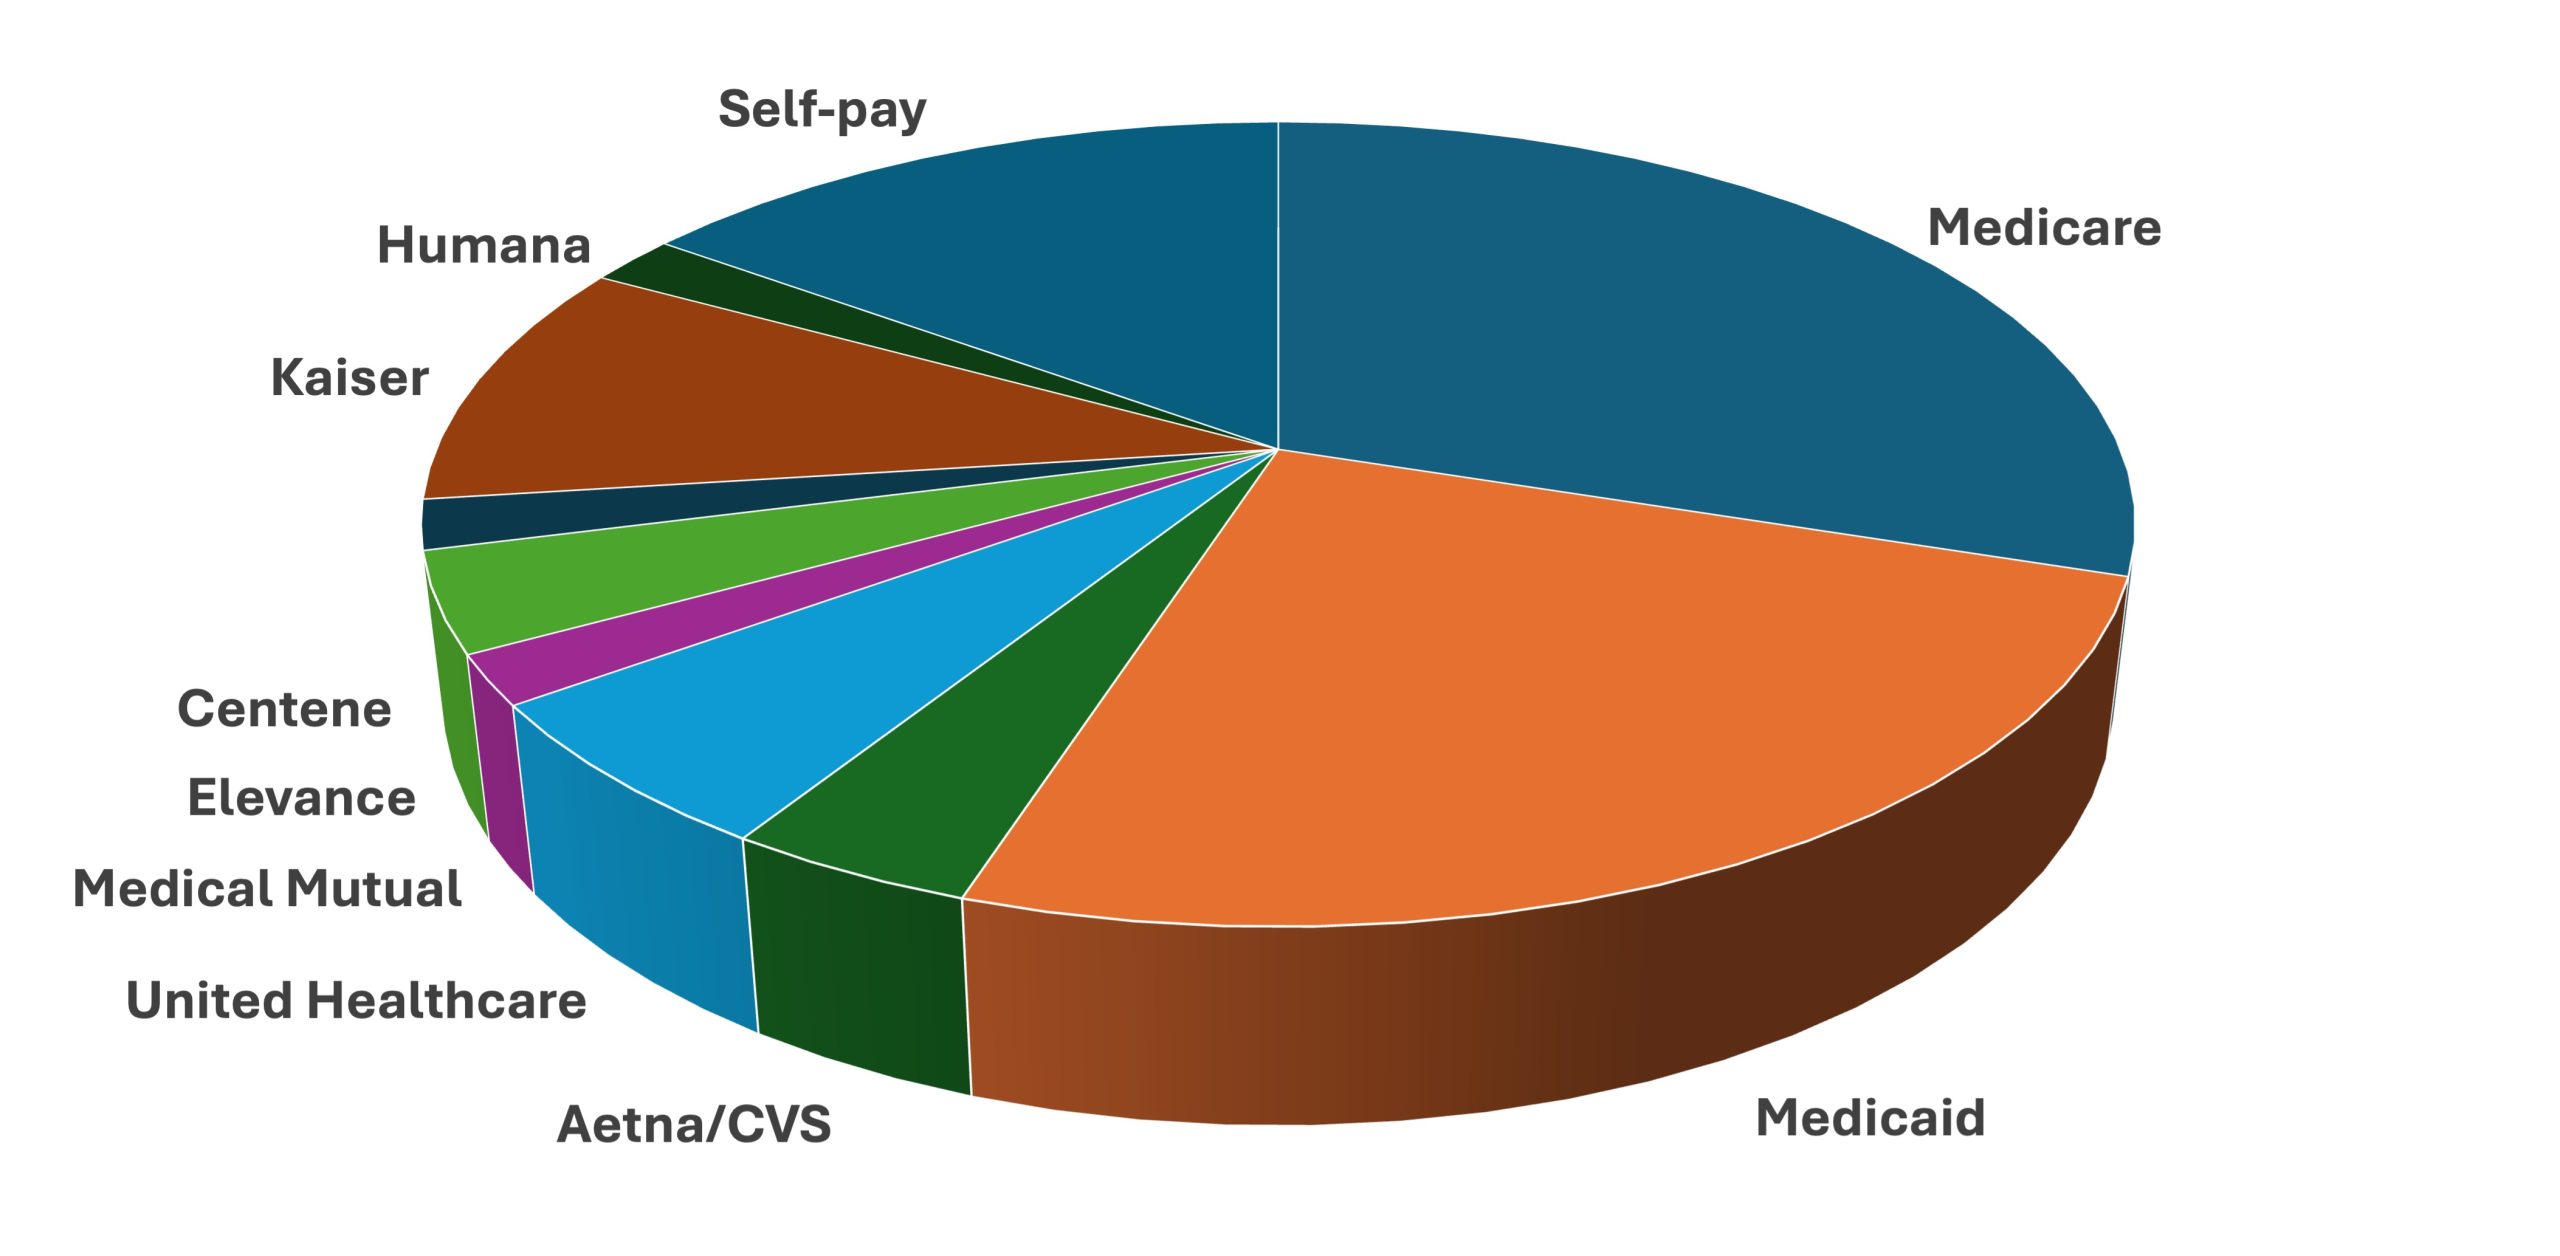
Broadly, payer mix refers to the percentage contributions of different payers to a healthcare facility’s revenue or patient population. Typically, the main payers include Medicare, Medicaid, various commercial insurance providers, and patients who pay out-of-pocket. However, depending on the practice setting or hospital type, other payers like workers’ compensation, Veterans Affairs, Department of Defense, CHIP, research grants, and disability programs can also be significant.
It is vital to understand the method used to express payer mix, as each approach offers different insights. Employing multiple methods allows a more comprehensive view of financial health and operational efficiency. These methods include:
Payer mix based on patient population
This approach calculates the percentage of patients in a practice or hospital attributed to each payer. For example, if a practice has 1,000 patients, with 450 covered by commercial insurance, 300 by Medicare, 150 by Medicaid, and 100 uninsured, the payer distribution is 45%, 30%, 15%, and 10%, respectively. While straightforward, this method has limitations. Since different patient groups utilize healthcare services at varying rates, it doesn’t accurately reflect revenue or effort. Medicare patients, typically over 65 or disabled, tend to have more frequent visits, hospitalizations, and surgeries, increasing resource utilization. Conversely, uninsured patients often avoid expensive elective procedures, skewing the perception of income contribution.
Payer mix based on receipts
In this method, the total annual income from clinical services is analyzed to determine each payer’s share. For instance, if a practice’s yearly billing totals $100,000, with $50,000 from commercial insurance, $30,000 from Medicare, $19,000 from Medicaid, and $1,000 from self-pay, the payer mix emphasizes actual income contribution rather than patient counts. This approach provides a clearer picture of revenue sources but falls short in depicting the effort or costs associated with different payers. Some payers reimburse at lower rates, and self-pay patients often pay less or nothing, making this method less effective for assessing workload or charity care obligations.
Payer mix based on charges
This perspective evaluates the total charges billed and allocates them proportionally to each payer. However, charges are often based on list prices, which rarely reflect actual payments. Insurance companies negotiate rates lower than listed prices, and government payers like Medicare and Medicaid reimburse at standardized, often lower, rates regardless of listed charges. As a result, this method can distort the true financial landscape, especially since most self-pay bills are written off or reduced due to income levels.
Payer mix based on patient days
Primarily used in hospitals, this approach measures the total number of patient-days attributed to each payer over a year. For example, a hospital might determine that Medicare patients account for a higher proportion of patient days because of longer stays, while Medicaid and commercial insurance contribute differently. This method often shows a higher percentage of Medicare in the payer mix than revenue-based methods because of the longer lengths of stay associated with older patients. It highlights the impact of patient demographics on hospital operations and revenue streams.
Payer mix based on Relative Value Units (RVUs)
For physicians, analyzing RVUs provides insight into the actual effort and resources dedicated to different patient populations. If a physician generates 4,000 wRVUs annually, with 1,600 billed to commercial insurers, 1,200 to Medicare, 800 to Medicaid, and 400 to self-pay, the payer distribution reflects the true workload. This method is superior for understanding physician productivity and reimbursement adequacy since charges don’t always correlate directly with effort or complexity.
What is the average payer mix?
Benchmarking payer mix against regional or national standards helps practices assess their financial health. A healthier payer mix typically features a larger proportion of higher-paying commercial insurance, while a less favorable mix may be heavily reliant on government programs or self-pay patients, risking financial sustainability.
Benchmarking using population coverage
One common method involves comparing a practice’s payer distribution to large-scale population data, such as the U.S. Census reports. For example, approximately 67% of Americans have some form of private insurance, while 37% are covered by public insurance programs, and about 8% are uninsured. However, this broad data has limitations. It doesn’t account for utilization differences—Medicare beneficiaries tend to use more services, while uninsured individuals often avoid routine care due to cost. Hence, matching payer mix to demographic-specific benchmarks, like those for a geriatric or pediatric practice, yields more relevant insights.
Benchmarking based on healthcare expenditures
Another approach considers the actual spending on healthcare by different populations. In 2022, Americans spent around $4.46 trillion on healthcare, with significant portions allocated to hospital and physician services. Government programs, including Medicare and Medicaid, fund roughly half of all healthcare services, with private insurance covering a larger share of outpatient and inpatient care. Comparing your practice’s payer mix to these expenditure patterns can reveal gaps and opportunities for adjustment.
Interesting:
- Understanding hospital payer mix and its impact on revenue
- The impact of empathy on effectiveness and well being in healthcare and social professions
- Understanding healthcare revenue cycle management and its impact on financial health
- The impact of managed care on healthcare economics and future trends
Reimbursement varies by payer
Payment rates differ significantly among payers. Healthcare providers bill a listed price, but the amount paid depends on negotiated rates, government fee schedules, and contractual agreements. Bills often show multiple components: the sticker price, negotiated contractual rate, patient co-pay, and adjustments. The sticker price—often called the “hospital charges”—is rarely paid in full, especially for insured or government-covered patients.
The reality of hospital and physician billing
For government payers like Medicare and Medicaid, reimbursement is standardized and predictable, with Medicare only paying the scheduled fee or DRG-based rates, regardless of the listed price. Commercial insurers negotiate rates that are confidential and vary widely; they often pay hospitals and physicians substantially more than Medicare or Medicaid. Because of these negotiations, hospitals and doctors set their charges higher than their expected reimbursements, aiming to avoid leaving money on the table. This practice results in most patients, especially those with insurance, paying amounts far below listed charges.
The plight of uninsured patients
Uninsured individuals are typically charged the full sticker price, but most cannot pay it. Hospitals often provide discounts or charity care based on income, reducing the financial burden. From a payer mix perspective, minimizing the percentage of self-pay patients is desirable, as they represent uncollected revenue and financial risk. Strategies include helping eligible patients enroll in Medicaid, promoting marketplace insurance plans, or establishing income-based payment plans.
Medicaid reimbursement
Medicaid, designed for low-income populations, generally reimburses providers at lower rates than Medicare, with an average of about 72% of Medicare’s rates across the U.S. This varies by state and specialty, with some services paid at as low as 67% of Medicare and others up to 80%. Many physicians limit Medicaid participation due to these lower reimbursements, impacting the payer mix by reducing the Medicaid share.
Commercial insurance reimbursements
Reliable data on commercial rates is scarce due to confidentiality agreements. Nonetheless, studies indicate that commercial insurers typically pay around 148% of Medicare rates for physician services, and hospitals often receive higher payments from private insurers than from government programs. Practices with a higher proportion of commercially insured patients tend to be more financially stable.
Payer mix varies by hospital size and type
Larger hospitals generally have a higher percentage of Medicaid and commercial insurance in their payer mix due to broader service offerings and patient demographics. Small or critical access hospitals often see a higher proportion of Medicare and lower commercial payers, reflecting their patient populations. Similarly, different hospital types—such as pediatric, psychiatric, or specialty hospitals—serve distinct demographic groups, shaping their payer composition.
Geographic influences on payer mix
States differ significantly in their payer landscapes, influenced by age demographics, military presence, and Medicaid expansion. For instance, Florida’s high Medicare population contrasts with Vermont’s lower Medicare share. States with numerous military bases, like Hawaii, have higher TRICARE coverage. These variations affect local practice payer mixes, emphasizing the importance of regional benchmarking.
The ideal payer mix
While 100% reliance on commercial insurance would maximize revenue, it’s impractical due to community service obligations and legal requirements. Non-profit hospitals and practices must provide charity care, and laws like EMTALA mandate emergency services regardless of payer. Balancing community needs with fiscal health requires understanding your region’s demographics and adjusting your strategies accordingly.
To optimize payer mix, practices should:
- Analyze local population coverage and adjust for patient demographics.
- Focus on attracting younger, commercially-insured patients through expanded services and outreach.
- Negotiate better rates with insurers and improve billing processes.
- Implement community engagement strategies, such as wellness programs, to draw in target populations.
- Leverage technology, like patient portals and online scheduling, to enhance access for insured patients.
Improving your payer mix
Shifting payer composition is challenging once a practice is established. Community demographics are largely fixed, but targeted efforts can enhance the payer mix:
- Assist eligible patients in enrolling in Medicaid or marketplace plans, reducing self-pay percentages. For example, Medicaid expansion in certain states significantly lowered self-pay rates at many facilities.
- Offer income-based payment plans for uninsured patients who cannot pay full charges.
- Limit new self-pay or Medicaid patients if financial sustainability is at risk.
- Explore programs like the Medicaid Upper Payment Limit Program, which allows qualifying physicians to receive higher reimbursement rates—improving their payer mix overnight.
- Expand services attractive to younger, commercially-insured populations, such as screening clinics or wellness programs.
- Enhance access for new primary care patients, fostering long-term insurance coverage.
- Engage with employers and community organizations to recruit insured patients.
- Invest in digital tools—patient portals, online appointment booking, and electronic payments—to appeal to tech-savvy, insured populations.
- Negotiate favorable contracts with insurance companies, understanding your practice’s strengths to secure better reimbursement rates.
It takes resources to optimize payer mix
Managing and improving payer mix requires investment in staff, technology, marketing, and negotiation. Larger practices and hospitals can allocate more resources toward these efforts, often perceiving the investment as essential for maintaining financial viability. Regular analysis of payer trends, benchmarking against regional data, and strategic initiatives are necessary to sustain a balanced and profitable payer mix.
For further insights into healthcare systems, visit this detailed overview. To understand how technological tools influence practice management, explore what constitutes a healthcare app. Comparing US healthcare expenditure patterns can be enlightening, available at this resource. Lastly, to grasp the role of data in healthcare decision-making, read about healthcare data.